Own Goal Trends in League Football and Effects on Multi Leg Bet Payouts
Clara Coleman · Oct 2, 2026
Own Goal Trends in League Football and Effects on Multi Leg Bet Payouts
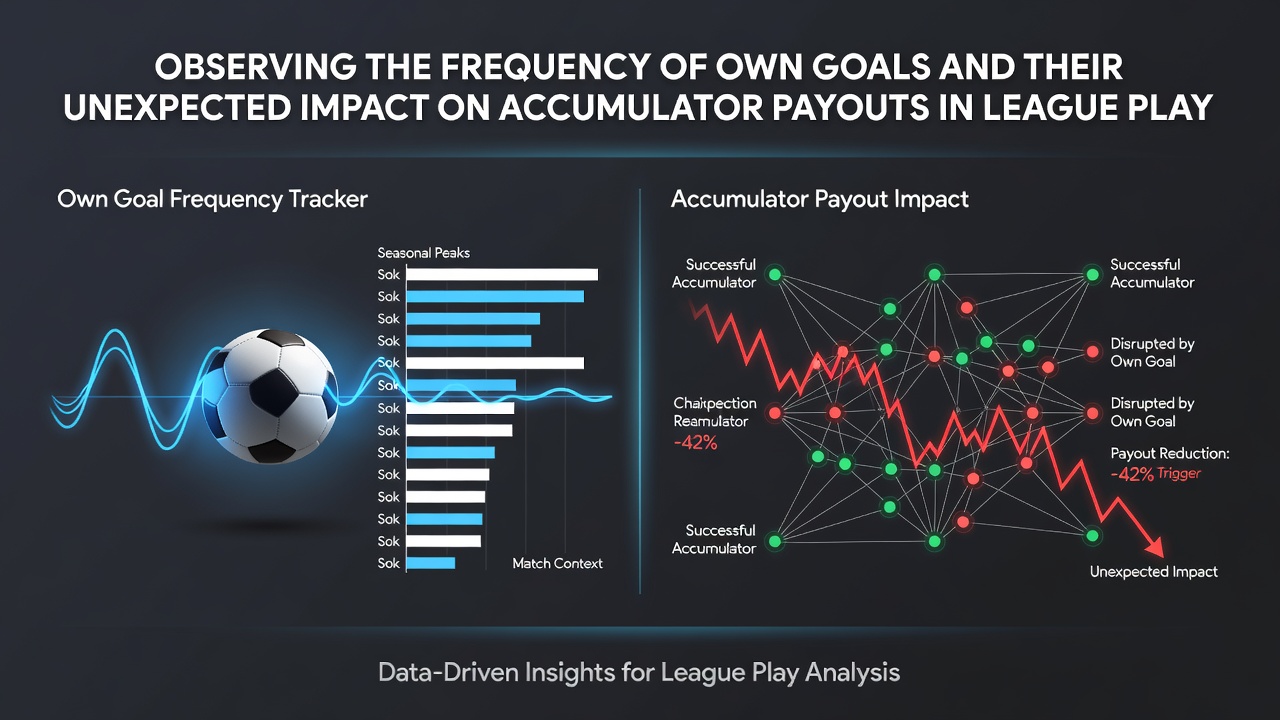
Own goals occur when a player directs the ball into their own net, and data from major European competitions reveals consistent patterns across multiple seasons. Researchers tracking match events note that these incidents appear in roughly 4 to 6 percent of all goals scored in top-flight leagues, with slight variations depending on defensive structures and set-piece volume. The frequency rises during periods of high pressing or when teams face compact defensive blocks that force hurried clearances.
Seasonal Patterns Across Competitions
Figures compiled through the 2025-2026 campaign show Premier League matches averaging one own goal every 8.7 fixtures, while Bundesliga encounters record a marginally higher rate tied to faster transition play. Observers note that Serie A and Ligue 1 maintain steadier distributions, although October 2026 data indicated a brief uptick linked to fixture congestion following international breaks. Teams that concede early often adjust positioning, which can either suppress or elevate the likelihood of further deflections in the same contest.
Impact on Accumulator Structures
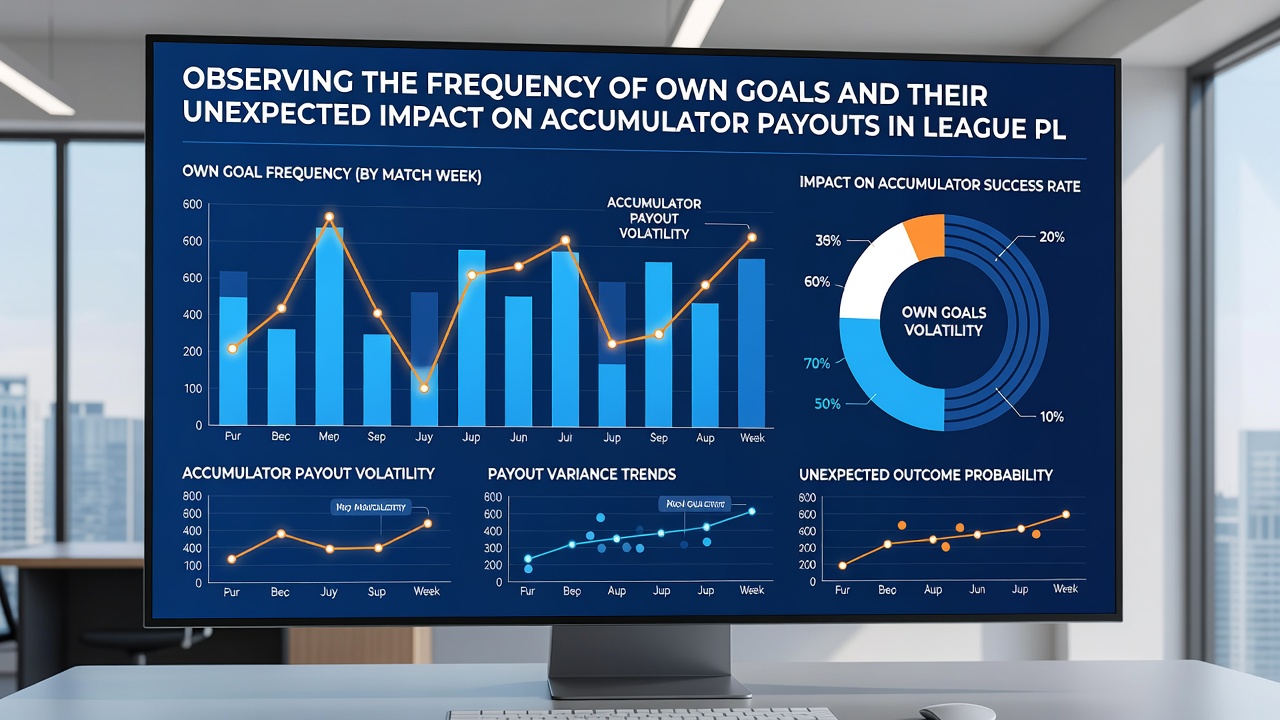
Accumulator bets require every selection to succeed for a payout to land, and an own goal can alter expected match outcomes in ways that disrupt carefully constructed combinations. When a defender scores against their side, the goal counts toward the opposing team yet shifts momentum without reflecting offensive superiority. Betting platforms register these events as standard goals, which means accumulators built around total goals, correct score, or team performance metrics absorb the change automatically. Data from analytics providers indicates that accumulators including matches with own goals show altered payout rates, particularly in legs focused on under 2.5 goals or both teams to score markets.
Analysts examining historical results find that own goals contribute to roughly 12 percent of all matches ending with unexpected scorelines relative to pre-match models. This percentage climbs when fixtures involve promoted sides or squads dealing with injury clusters in central defense. Those constructing accumulators across multiple leagues must therefore account for defensive error rates rather than relying solely on attacking output statistics.
Case Examples From Recent Campaigns
One documented instance occurred in a November 2025 Premier League fixture where a single own goal shifted a projected low-scoring draw into a narrow away win, invalidating several multi-leg bets that had included both teams to score. Another case in La Liga during February 2026 featured two own goals within five minutes, pushing a contest well beyond projected goal totals and affecting live accumulator adjustments. Such sequences remain uncommon yet carry measurable influence when they coincide with legs already containing narrow margins.
European football governing bodies and independent research groups continue to monitor these events through standardized event data. According to reports published by UEFA technical departments, set-piece situations account for over 40 percent of own goals, while open-play deflections make up the balance. Australian wagering regulators have also referenced similar patterns in their domestic competitions, noting comparable effects on multi-leg products when defensive lapses occur late in halves.
Statistical Context and Adjustments
Studies from academic sports analytics programs demonstrate that teams with higher pass completion rates in their own third experience fewer own goals, whereas sides favoring long clearances show elevated exposure. Accumulator participants who incorporate team news on defensive personnel often achieve more stable modeling, although no selection process eliminates variance entirely. Figures released through industry research networks indicate that own-goal frequency has remained stable over the past five seasons despite tactical evolution toward higher defensive lines.
Conclusion
Tracking own goal occurrences provides measurable context for understanding variability in accumulator returns across league schedules. Consistent data collection from multiple competitions shows that these events, while infrequent, produce distinct shifts in match results that propagate through multi-leg betting structures. Observers and analysts continue to integrate defensive error metrics into broader evaluation frameworks, allowing clearer assessment of how such incidents interact with seasonal trends and fixture demands.