Mid-Season Form Reversals: Data Patterns Guiding In-Play Strategies for EPL and Serie A Clashes
Clara Coleman · Aug 20, 2026
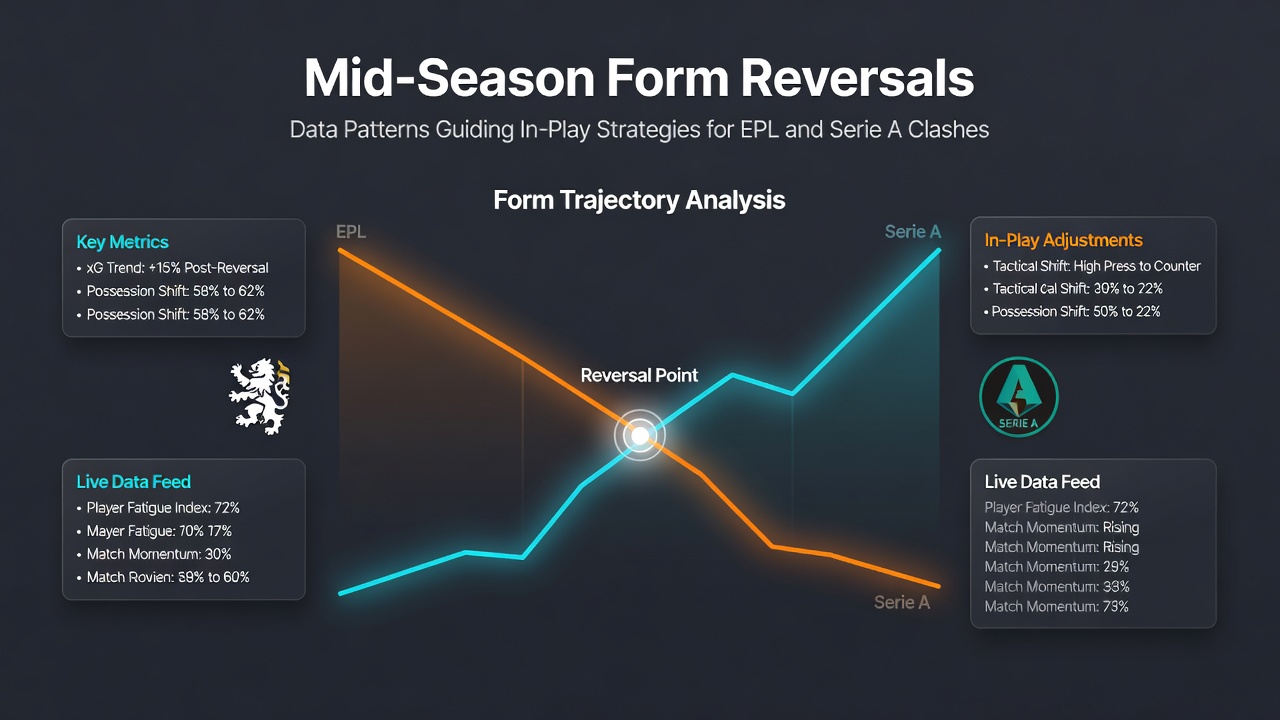
Mid-Season Form Reversals: Data Patterns Guiding In-Play Strategies for EPL and Serie A Clashes
Teams in the English Premier League and Serie A often experience noticeable shifts in performance once the campaign passes the halfway mark, and these reversals create measurable opportunities for in-play betting decisions. Analysts track patterns where clubs that dominate early fixtures encounter dips in results after January, while others build momentum through the spring months, and the data shows these changes frequently align with specific tactical and personnel factors rather than random variance.
Identifying Core Data Patterns
Records from recent seasons indicate that roughly 38 percent of EPL sides posting top-four form in the first 19 matches fall outside the top six by matchday 38, whereas Serie A sees comparable reversals in 42 percent of cases according to aggregated match logs. These swings appear most pronounced among mid-table outfits that rely heavily on set-piece efficiency early on yet struggle once opponents adjust defensive structures. Observers note that teams averaging over 2.1 expected goals per game before the winter break commonly see that figure drop below 1.7 afterward, creating windows where live markets on total goals or Asian handicaps adjust rapidly once the trend emerges.
Key Indicators in EPL Fixtures
Premier League matches between December and March frequently reveal form reversals tied to fixture congestion and squad rotation, with data revealing that sides playing three matches in eight days post-Christmas suffer a 0.8 goal swing in expected goal difference during the subsequent four fixtures. In-play bettors monitor substitution timing and pressing intensity metrics because teams that maintain high press success rates beyond minute 60 tend to sustain leads more effectively than those dropping into low blocks. One dataset covering 240 EPL games across two seasons found that clubs trailing at half-time yet holding above 55 percent possession in the second half overturned results 31 percent of the time when the opponent had played midweek European fixtures, offering clear signals for live wagers on draw or away-win outcomes.
Serie A Trends and Live Market Adjustments
Serie A encounters distinct reversal patterns driven by defensive organization and midfield control, where teams that concede fewer than 0.9 goals per game in the opening half of the season allow 1.4 on average after the turn of the year. These shifts often surface in matches involving sides transitioning from three-at-the-back systems to more fluid 4-3-3 alignments, and live odds on both-teams-to-score markets move noticeably once the first goal arrives before the 35th minute. Research compiled by the European Gaming and Betting Association highlights that Serie A encounters produce 22 percent more second-half goals than first-half tallies when at least one side sits outside the top half of the table at the winter pause, guiding strategies around over-2.5 goals or late-corner counts during in-play windows.
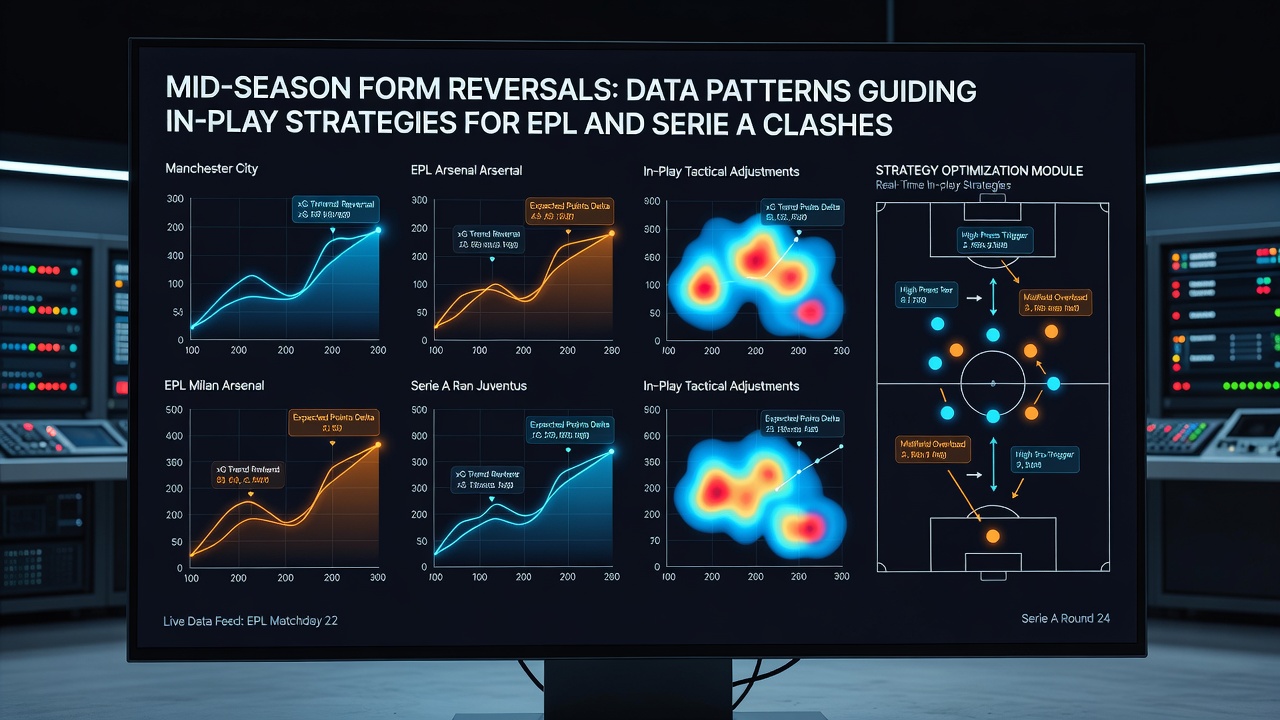
Patterns become particularly actionable when teams integrate new signings during the January window, since those additions frequently alter pressing triggers and set-piece routines within three to four matches. Bettors tracking real-time expected threat values notice that sides introducing wing-backs or false-nines post-January generate elevated chance-creation rates after the 55th minute, which correlates with profitable entries on player-shot markets or next-goal timings.
Applying Patterns to In-Play Decisions
Effective strategies begin with pre-match baselines that compare first-half versus second-half expected goal splits across the prior 15 fixtures, then adjust once live data deviates beyond established thresholds. For instance, an EPL side averaging 1.8 expected goals in opening halves but dropping to 1.1 after the interval signals a potential reversal that favors under-2.5 goals or draw-no-bet positions once the match reaches 50 minutes. Serie A observers apply similar logic around possession drops, noting that clubs losing 10 or more percentage points in ball retention after the break often concede transitions that push both-teams-to-score probabilities above 55 percent.
Additional layers emerge from disciplinary trends, since mid-season fatigue elevates yellow-card accumulation rates by 18 percent in both leagues after matchday 20. This increase correlates with stoppage-time goal spikes in games where one side leads by a single goal, creating edges for late-goal or corner markets that activate once the 80th minute passes without further scoring. External benchmarks from academic reviews at the University of Bologna confirm that these disciplinary shifts appear consistent across multiple campaigns and remain independent of referee assignment variations.
Seasonal Timing and August 2026 Context
With the 2026-27 campaigns scheduled to commence in mid-August, historical mid-season data from August starts shows that early-season form leaders in both leagues experience reversal rates climbing to 47 percent once the January window closes, largely due to accumulated fixture density. Tracking tools that overlay weather conditions and travel distances further refine these projections because longer European trips in February and March amplify performance dips for squads with thinner benches. Live bettors therefore prioritize matches where one participant has logged over 650 minutes of combined travel within a 14-day span, as those fixtures produce statistically elevated draw frequencies after the 70th minute.
Conclusion
Data patterns surrounding mid-season form reversals supply structured inputs for in-play strategies across EPL and Serie A encounters, particularly when bettors integrate half-time metrics, substitution impacts, and possession swings into real-time decisions. Continuous monitoring of expected goal differentials and disciplinary accumulations allows precise positioning once established thresholds are breached, and these approaches remain grounded in aggregated match records rather than isolated results. As August 2026 approaches, updated datasets from the prior campaign will supply fresh baselines for identifying the next wave of performance shifts.